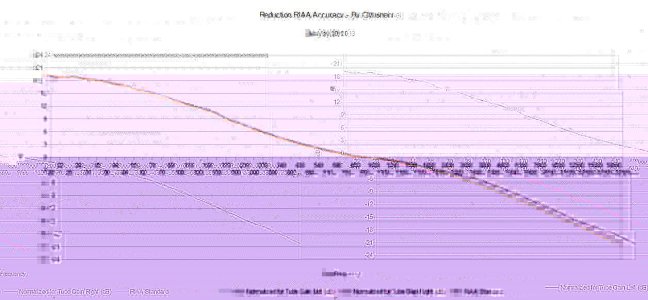
Doc B Former President For Life Staff member May 10, 2013 #1 PB painstakingly plotted the response curve of the Reduction production prototype and put together a graph showing deviation from the RIAA standard. It's pretty dadgummed close - Attachments Reduction_RIAA_worksheet_html_624efde2.jpg 54.4 KB · Views: 447
PB painstakingly plotted the response curve of the Reduction production prototype and put together a graph showing deviation from the RIAA standard. It's pretty dadgummed close -